
Following a choppy start to 2018, the U.S. stock market climbed 8% in the third quarter. However, most of those gains were given back during the recent sell-off. Even with the pullback, longer term returns have still been impressive: through October 24th, the trailing five-year and ten-year returns for the S&P 500 were 10.9% and 14.1%, respectively (annualized).
But eventually the clock will strike midnight and the bull market will end. What that means for the coming week, month, or year is anybody’s guess. As Warren Buffett noted in his 2016 shareholder letter, “The years ahead will occasionally deliver major market declines – even panics – that will affect virtually all stocks. No one can tell you when these traumas will occur – not me, not Charlie, not economists, not the media.”
We agree with that sentiment. We could point you to a long list of market prognosticators who have called for impending doom multiple times over the past decade. If they’ve taken their own advice, they have undoubtedly cost themselves (or more likely their clients) a lot of money.
As shown below, trying to call the peak can be costly if your timing isn’t impeccable. Starting on the left, we can see that selling two years prior to the beginning of a bear market has resulted in missing a 41% move higher on average (this data is based on the eleven market declines of 20% or more since 1945). Now think about the fact that some have been calling for this bull market to end since 2011 or 2012. If you’ve sat out on the bull market for many years, the opportunity cost has been much higher (the S&P 500 is up nearly 70% over the past five years, before dividends).
As we move to the right on the chart, we can see the penalty for calling a top too early becomes less onerous as your timing improves (which isn’t surprising). What we find particularly compelling is the right side of the chart (“average return after peak”). As you can see, the S&P 500 has fallen 14%, on average, one year after the peak. Looking out further, we see the average return two years from the top (24-months into the bear market) has been an immaterial loss.
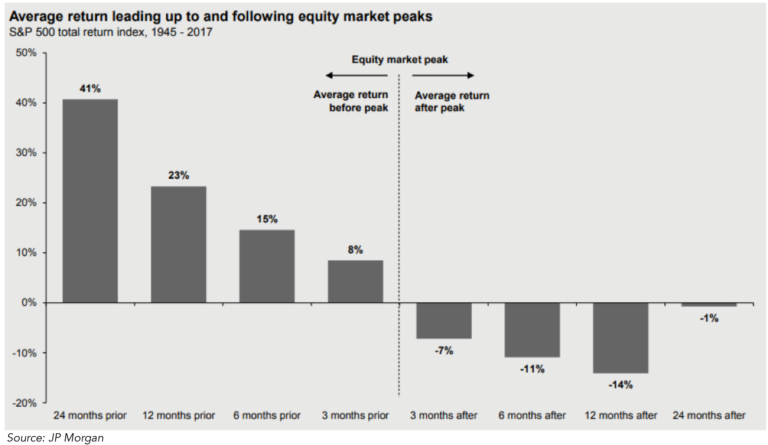
The takeaways here are two-fold: First, if you’re a few years early trying to time the market, you can pay a significant price (in terms of opportunity cost). On the other hand, if you stay invested and are forced to live through a downturn, the pain has historically been resolved in a few years.
There’s a good reason this occurs: the market moves higher over time. There are fundamental reasons why we’ve seen 9% – 10% annualized return from equities over the past 50-100 years (including dividends).
Long-term equity returns come from two sources: dividends and earnings growth (with prices moving in tandem with earnings over the long run).
Starting with dividends, the yield for the S&P 500 has trended lower over the past sixty years (the current dividend yield for the Index is just under 2%). This partly reflects a lower dividend payout ratio as companies have shifted a portion of their capital returns to share repurchases (repurchases have reduced the number of shares for S&P 500 companies by ~1% per annum).
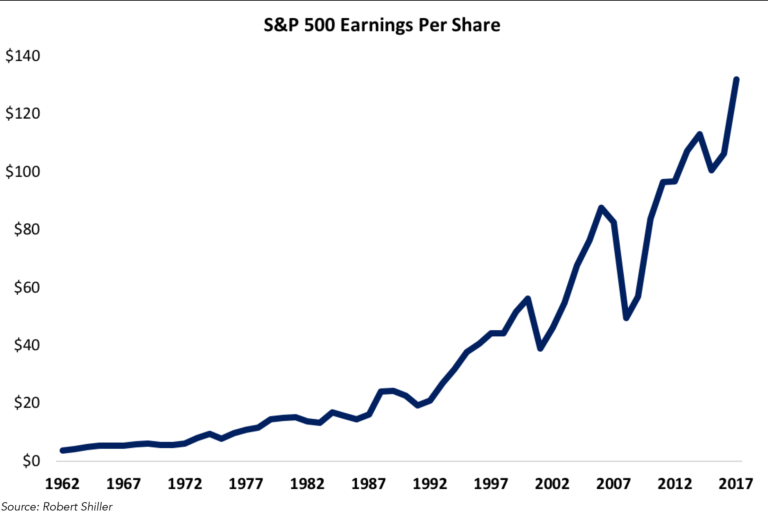
The second contributor to returns is earnings (EPS) growth, which is the result of the reinvestments a corporation makes in its business through retained capital. This chart shows the long-term trend for S&P 500 earnings (20-year trailing annualized growth).
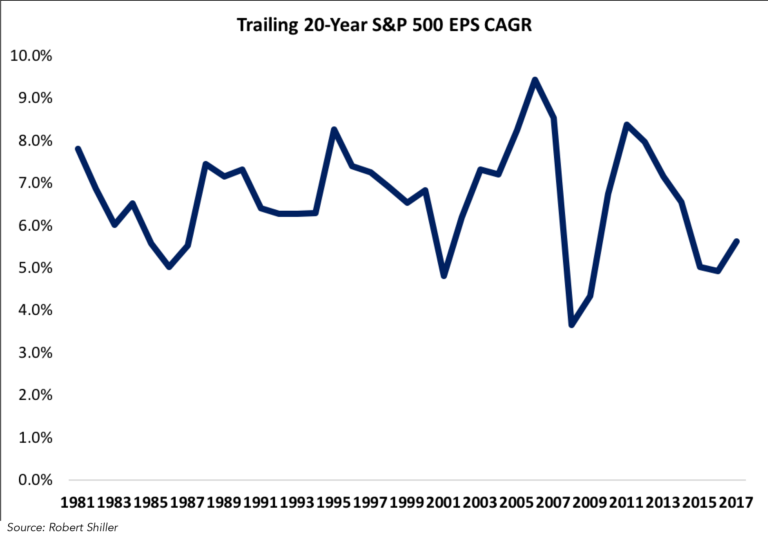
Over the past fifty years, earnings for the S&P 500 increased by roughly 6.5% per year.
As noted above, earnings increased over time because companies reinvested in their business. Think of a $1 million bank account that pays 5% in interest. In the first year you earn $50,000 in interest income (5% on $1 million). If you “reinvest” the proceeds in your account at the same 5% interest rate, year two “earnings” will increase to $52,500 ($1,050,000 * 5% = $52,500). Note that the growth rate of earnings ($52,500 / $50,000 = +5%) matches the incremental return earned on your capital (the same 5% interest rate on the additional $50,000). If you reinvested $40,000 of the $50,000 (80%), year two earnings would’ve increased 4% (to $52,000). Here’s the takeaway: earnings growth is equal to the incremental rate of return on capital (in this case 5%) multiplied by the retention rate (the percentage of earnings reinvested in the business).
The same math applies to S&P 500 earnings growth. Using rough numbers, the retention ratio for the S&P 500 has been in the range of 40% – 50%, multiplied by an incremental return on equity in the mid-teens (Barclay’s estimates the ROE for the S&P 500 has been roughly 14% over the past forty years), which has produced long-term EPS growth of 6% – 7% per year.
Compounded over decades, mid-single digit EPS growth will produce astounding results:
Conclusion
Over the long run, dividends and earnings are the fundamental drivers of equity returns (higher stock prices). But that doesn’t tell us anything about what will happen in the short-term. People that hop in and out of the market are assuming that their timing ability will be able to offset the decision to bet against (at least in terms of opportunity costs) the long-term value creation outlined above. As you may suspect, we think that is ill-advised and likely to impair returns.
For this reason, we think it makes sense to maintain a structural asset allocation (essentially a fixed weighting between stocks and bonds). Our preference is to allocate as much to equities as possible, with the constraint being a client’s ability and willingness to bear risk.
As investors, we accept the trade-off we’re making with clear eyes: we accept the short-term pain that comes during bouts of market volatility in exchange for outsized rates of return (over the long run) relative to other asset classes like high-quality fixed income.
Our hope is clients understand and have the conviction to maintain their asset allocation through a full market cycle. If you have questions regarding your asset allocation, please don’t hesitate to let us know.
Disclosure
This article does not represent a specific investment recommendation. No client or prospective client should assume that the above information serves as the receipt of, or a substitute for, personalized individual advice from The Fiduciary Group which can only be provided through a formal advisory relationship. Clients of the firm who have specific questions should contact theirThe Fiduciary Group advisor. All other inquiries, including a potential advisory relationship with The Fiduciary Group, can be directed here.