
As with most investors, our goal is to maximize the total return that we receive from an investment (within a risk-adjusted framework). Total return is comprised of two components: 1)the income received (interest from fixed-income investments and dividends received on equity investments), and 2) the capital appreciation due to the change in the market value of an asset. In theory, investors should be agnostic as to whether their total return is derived from income or capital appreciation (as long as long-term goals are being met), but for retirees who are living off of their portfolio and for pension funds and insurance companies that have to meet current and future liabilities, there is a real benefit from generating income.
The saying, “a bird in hand is better than two in the bush” aptly describes the appeal of income over capital appreciation as it connotes certainty. In addition, the return from the income portion of a portfolio is usually deemed to be more consistent and reliable than valuation gains. Thus, investing in income generating assets intuitively makes good sense, and investors often gravitate toward said investments. However, persistently low interest rates over the last several years have resulted in a premium being placed on income producing assets, and the search for yield has become increasingly difficult, particularly in the fixed income space.
Against the backdrop of a likely increase in the Federal Funds rate this year, we thought it would be interesting to address the landscape for income and yield from both an equity and fixed income perspective. We’ll start with an overview of the current yield environment and then discuss where we see opportunities and risks as we transition to less accommodative monetary policies in the U.S.
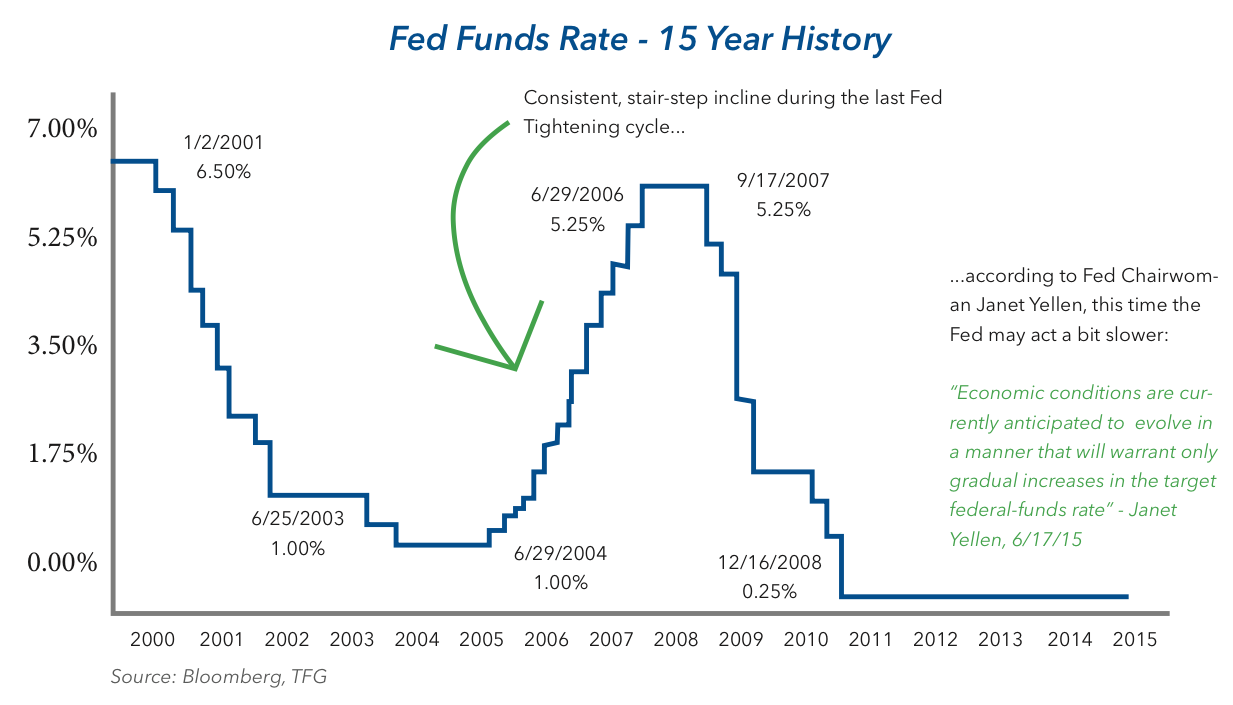
One of the primary drivers of the bull market in bonds since the financial crisis has been the reduction in the Federal Funds rate from 5.25% in September 2007 to a 0.00%-0.25% target in December 2008, where it has since remained. Long gone are the days when one could earn close to 5% on money market funds! Savers have been receiving close to zero percent on their cash for some time, and this paltry return is one of the reasons that investors have been willing to extend investment horizons and accept added credit risk in order to obtain yield.
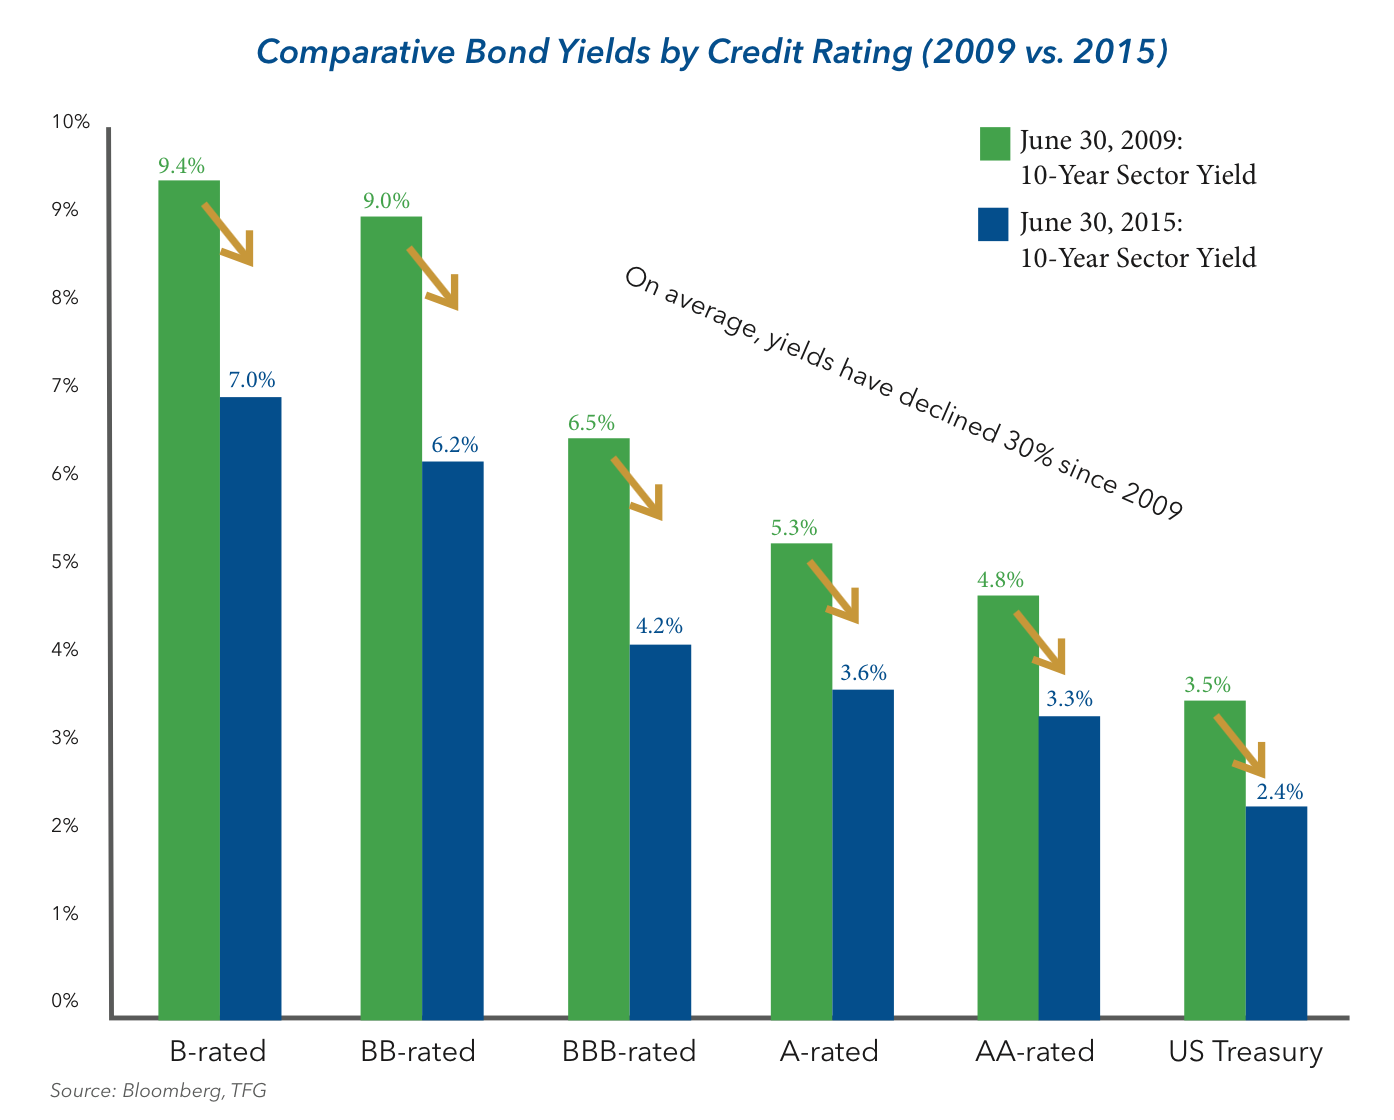
We can see this behavior borne out in the chart below which compares 10-year yields along the credit-risk spectrum as of 6/30/09 with yields as of 6/30/15. The yield on the U.S. Treasury security has compressed from 3.5% to 2.4%, a difference of 1.10%. Interestingly, the yields on BBB (investment-grade) and BB (non-investment grade) rated bonds have declined by 2.3% and 2.8%, respectively, reflecting not only spread tightening between the two periods, but also a willingness by investors to sacrifice credit quality for comparable yield. In plain language, investors who required a 6.5% yield for investment-grade paper in 2009 are now willing to accept a lower 6.2% yield for a non-investment grade security. For that matter, nominal yields are lower across the credit spectrum.
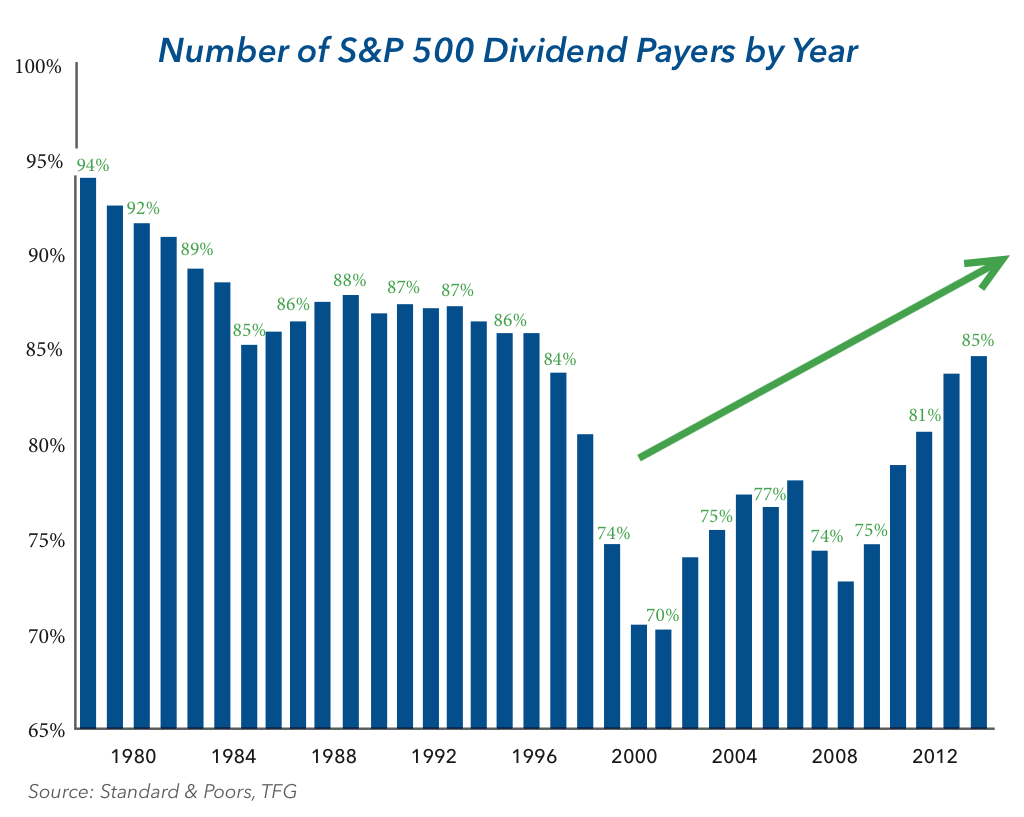
The skimpy rates in fixed income have led many income oriented investors to the equity market in search of yield. Strong operating fundamentals and low interest rates over the last few years have translated into healthy balance sheets and robust cash flows for corporations. As a result, an increasing number of companies are rewarding shareholders through dividends. As the chart on the next page shows, 85% of the companies in the S&P 500 Index pay dividends, up from 75% a decade ago. We expect this trend to continue in tandem with improved economic conditions and demand from additional retirees. The leading edge of the 65-million-member baby boomer cohort turns 70 next year, and we would expect income generation to be at the top of their list.
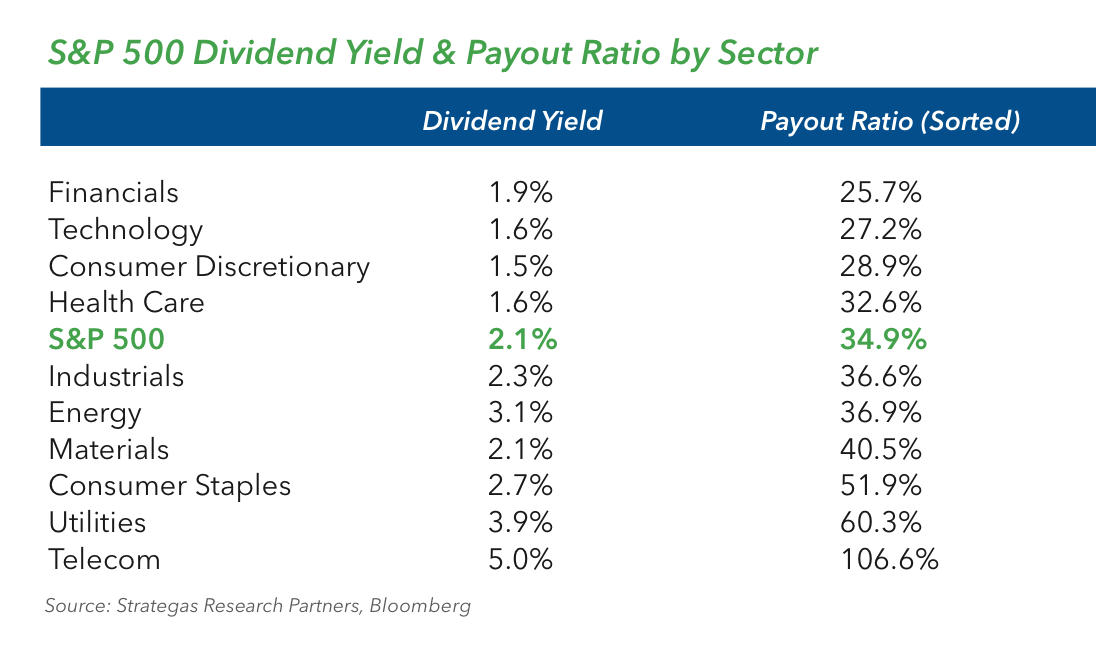
Companies also have ample resources to increase dividend payments, which should continue to attract investors. One measure of dividend paying capacity is the dividend payout ratio, which measures the percentage of earnings paid to shareholders in dividends. As the chart below shows, the average ratio for the S&P 500 Index is 35%, a very sustainable level with room for growth, in our view. Yields across sectors are attractive, and the average dividend yield of 2.1% on the S&P 500 Index is appealing relative to the 10-year Treasury bond’s yield of 2.4%.
As the Fed prepares to raise short-term rates, both stock and bond market investors should expect increased volatility. Volatility can create opportunity when viewed rationally. The pertinent questions for investors to ask are: how much will rates rise, how fast will they rise, and how will the shape of the yield curve change? Of course, these are difficult questions to handicap, but understanding how and why different securities may be affected by the pace and magnitude of changing rates is a good starting point for assessing portfolio risks and opportunities.
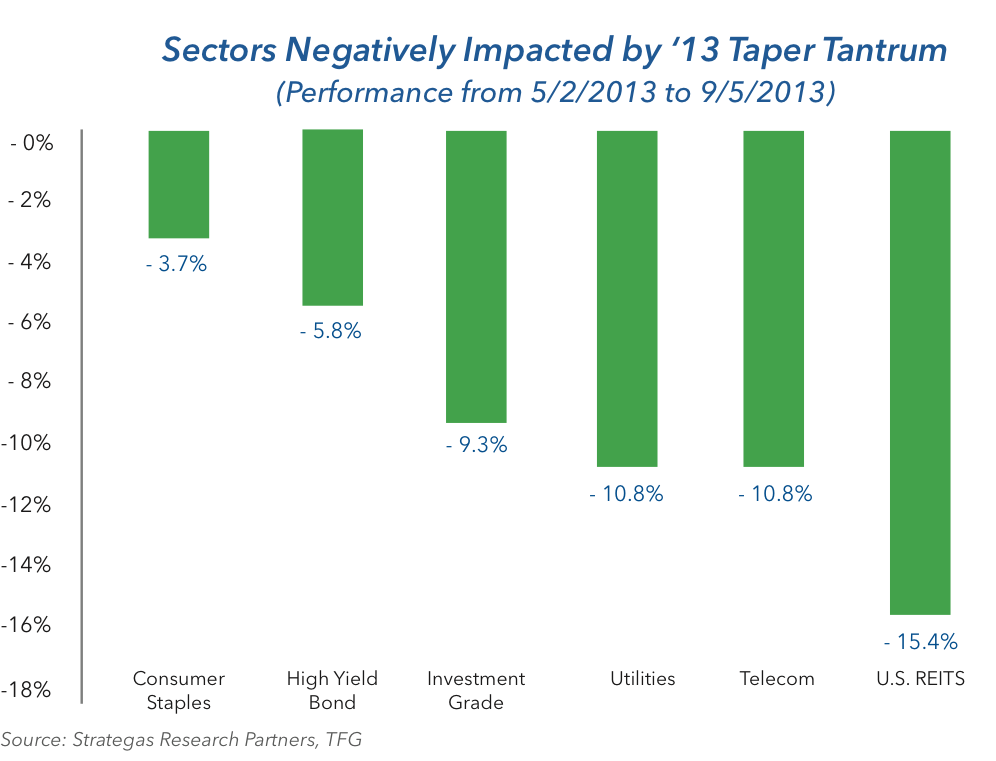
During the period from May 2013 to September 2013, we witnessed a relatively quick upward surge in long-term rates and a steepening of the yield curve as the 10-Year Treasury bond’s yield rose from 1.6% to 3.0% in response to communication by the Federal Reserve that it would begin tapering its purchases of long-dated U.S. Treasury securities. How different securities reacted during this period is instructive. As the chart above shows, the high yield bond sector fared relatively well, while high yield- ing stock sectors (REITs, telecommunications, utilities) suffered the most on a relative basis. Certainly, stocks tend to be more volatile than bonds, so that is part of the explanation. But, there are two other reasons we will posit. First, high yield bonds by virtue of their high coupon have a shorter duration, making them less sensitive to rising rates than their high yield equity counterparts. Second, the high yielding equities had been the beneficiaries of a flight to yield, so valuations were stretched in our view.
nature of the Federal Reserve and the inconsistent recovery mean that the path to higher rates via a rise in the Federal Funds rate will be gradual. In contrast to the example above, we would expect the yield curve to flatten modestly as short-term rates go up more than long-term rates. When positioning portfolios, we would be buyers of both equity and fixed income in order to generate income. On the equity side, we favor companies that have the ability and intent to grow their dividends.
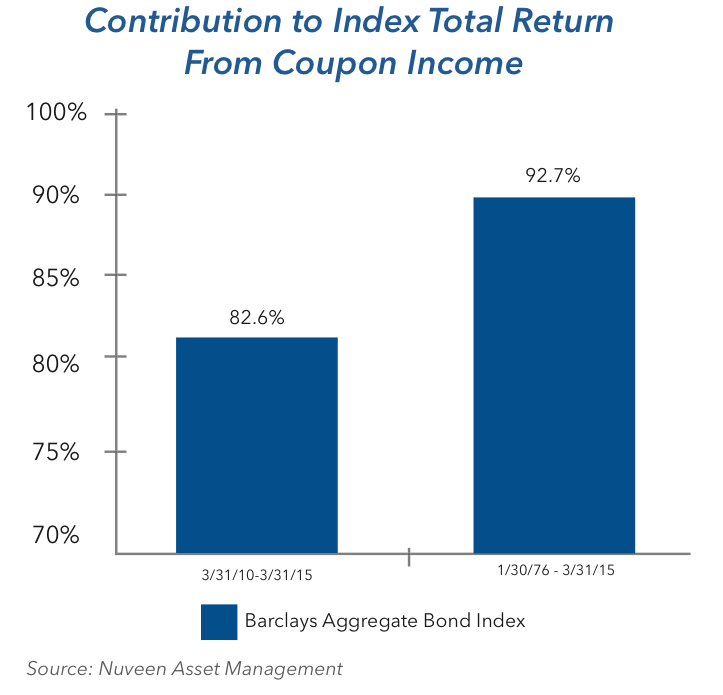
We would also be attracted to higher yielding equities on an opportunistic basis, especially if we experience another rapid move in rates. When evaluating bonds, patience is still important. While modestly higher money market rates will be welcome, managing credit and interest rate risk remains our focus. The low current yield environment leads us to continue to favor credit exposure rather than duration, as we seek to generate yield and minimize interest rate sensitivity. Lastly, as the chart below shows, investors should be well served to rely on their periodic interest payments, as income rather than price has been the primary driver of fixed income returns over the long-term.