
At the end of August, ExxonMobil, Pfizer, and Raytheon Technologies were replaced in the Dow Jones Industrial Average by Salesforce.com, Amgen and Honeywell International.
ExxonMobil’s removal is notable because the company has been a member of the Dow for more than 90 years: Standard Oil Company of New Jersey, a predecessor to ExxonMobil, was added to the Dow in October 1928. At the time, it joined a list of companies that included General Electric, General Motors, and Sears, Roebuck and Co. But change is nothing new here: over the decades, every single company that was part of the Dow in the late-1920’s has been replaced.
Given this recent reshuffling of the Dow, we thought it would be worthwhile to shed some light on the history of the index. The Dow Jones Industrial Average, which first appeared in the Wall Street Journal on May 26th, 1896, was originally a composite of 12 industrial companies selected by Charles Dow (he also created the Wall Street Journal, which published its first issue on July 8th, 1889). Today, the Dow consists of 30 large corporations, with representation across the various economic sectors. The index is maintained by S&P Dow Jones Indices, with constituent companies chosen by a five-member selection committee.
The Dow is a price-weighted index, which means companies with a higher stock price have a larger weighting. That’s striking because a company’s stock price is a completely arbitrary number. For example, Apple recently completed a four-for-one stock split, with the stock price falling from around $500 per share to $125 per share. As a result of this decision, Apple’s weight in the index declined from more than 10% on August 30th to less than 4% on August 31st.
In fact, Apple’s stock split was what led the committee to make the changes in August. According to a S&P Dow Jones Indices press release:
“The index changes were prompted by DJIA constituent Apple Inc.’s decision to split its stock 4:1, which will reduce the index’s weight in the Global Industry Classification Standard (GICS) Information Technology sector. The announced changes help offset that reduction.”
The need to make these adjustments points to the shortcomings of the Dow. Consider their selection process for the replacements: was Salesforce.com a more appropriate business to select than companies like Amazon or Alphabet (Google)? Probably not. But it was a more suitable stock for the Dow because shares of Amazon and Alphabet trade at high prices (well north of $1,000 per share), which would lead to concentration issues for the price-weighted index.
In summary, as a result of the limited number of companies in the index, as well as its faulty construction (price-weighted), we believe the Dow offers an incomplete picture of how equities, broadly speaking, are performing. It’s a poor proxy for “the stock market.” Given that, we find it interesting that reputable publications like The Wall Street Journal still quote the Dow. If we had to venture a guess, the scale of the numbers – and its ability to garner attention – is what matters to them (“Dow Falls More Than 1,000 Points” is catchier than “The S&P 500 Falls 120 Points”).
A Look at the S&P 500
By contrast, the S&P 500 represents the performance for a broader range of U.S. companies, utilizing a capitalization-weighted construction (with an adjustment to account for the number of shares available for trading). Standard & Poor’s, which created its first stock market index in 1923, introduced the S&P 500 on March 4th, 1957. At the time, American Telephone & Telegraph (AT&T) was the largest weighting in the index. Today, the 10 largest companies in the index are Apple, Microsoft, Amazon, Alphabet (Google), Facebook, Johnson & Johnson, Berkshire Hathaway, Visa, Procter & Gamble, and JPMorgan Chase. In addition to a market cap (size) requirement, there are other criteria that a company must meet before it can be added to the index. A well-known example in recent years has been Tesla, which currently has a market cap of more than $300 billion, but has been excluded from the index in the past because it did not meet the other requirements set by the S&P Index Committee (criteria based on profitability).
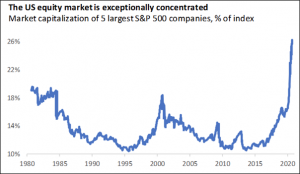
While the number of companies in the S&P 500 suggests broader diversification than the Dow, that’s not an entirely accurate conclusion to draw. At the end of August, the five largest companies in the S&P 500 – just 1% of the stocks in the index – accounted for 24% of its value. What’s marketed as a broadly diversified index is actually a reasonably concentrated portfolio with a large allocation to a handful of tech companies which are exposed to similar end markets (cloud computing, online advertising, etc) and long-term concerns (regulatory risk). In summary, the market-cap-weighted construction of the S&P 500 can provide a false sense of diversification and what’s really happening in the broader stock market.
Managing to an Index
Market participants closely watch indices like the Dow and the S&P 500, using them as benchmarks to measure portfolio performance. However, as we’ve discussed above, these indices can offer a relatively skewed view of “the market.” To be clear, that does not mean we disregard their use as relevant long-term benchmarks for equity investors. Instead, we want to convey to clients that there are trade-offs associated with focusing too much on one index.
The challenge, from our perspective as investment advisors, is balancing our fiduciary role, particularly as it relates to risk management, with the nature of a market-cap weighted index like the S&P 500. As an example, consider the weighting of the five largest companies in the S&P 500, particularly compared to what that concentration has looked like in recent decades.
An analysis of the five largest companies in the index also shows that they’ve meaningfully benefited over the past five years from higher valuations. For a fiduciary, this presents a conundrum: while the stocks may have become less attractive (more expensive) to a long-term investor, they’ve become an even larger part of the index. Said differently, if you decide to trim a position in any of these stocks, or even to go as far as selling them entirely, you are making a change that goes against the current consensus (in addition to the fact that selling shares in these companies is likely to result in paying capital gains). It’s easy to own what everyone else owns, particularly if it’s working. But it may still be the right decision to do the opposite.
To be clear, each of the five largest companies in the S&P 500 are good companies. The question is whether they represent attractive investments at today’s prices.
As advisors, we try to balance the interests of clients – for example, continuing to own what’s performed well – with our need to continue making smart decisions for them based on the facts on the ground today. What may have been a great investment opportunity five years ago, and ultimately became a big winner in your portfolio, may not be as attractive today.
We will continue to be transparent about how we approach these kinds of decisions. We endeavor to be a firm that constantly works towards improving the outcomes we deliver to you.
And, as always, it’s important to keep discrete buy or sell decisions within the context of the broader objectives of a portfolio. Diversification across asset classes and major geographies remains a core tenet of our approach to portfolio construction.
As always, please contact us if you have any questions or concerns.