
“Antidote”: Something that works against an unwanted condition to make it better.
Investors might agree that market volatility is an unwanted (though unavoidable) condition. What works against it to make it better? The antidote is choosing—and sticking with—a strategic asset allocation target that meets your return objectives while respecting both your financial capacity to deal with, and psychological tolerance for, market volatility.
I’m going to show how this works, but first, let’s lay the foundation.
Strategic asset allocation is the breakdown in an investment portfolio between equities (stocks), fixed income (bonds), cash and, where appropriate, alternative investments. We’ll focus here on stocks, bonds, and cash. Historically, stocks as an asset class have provided higher annualized returns over the long-term than other types of investments, but with a high level of volatility. Price movement can be unpredictable and fluctuate widely. Bonds historically have had lower annualized returns over the long-term than stocks, but with lower price volatility. Cash and cash equivalents should have no volatility. Cash investments hold their dollar value, but generate only modest returns.
How much you should allocate to stocks, bonds, and cash in your investment portfolio depends on your objectives for the portfolio (ie., growth, income, capital preservation), liquidity needs (how much you will be withdrawing and with what frequency), time horizon (how long the assets will be invested), and personal risk tolerance (your psychological ability to tolerate swings in the value of your portfolio). Investment accounts that will be consumed in a short time (such as a college savings account that will be used for tuition soon) will be allocated quite differently than a retirement savings account that has a 10+ year time horizon before withdrawals begin.
A general rule of thumb is to hold enough cash to cover 6-12 months of withdrawal needs, enough bonds to cover another 5-7 years of withdrawals, and the balance in stocks. The rationale is that an allocation of cash and bonds sufficient to cover 7+ years of income needs will allow you to “ride out” any big swings in the market because you won’t be forced to liquidate stocks at an inopportune time.
Retirees who rely on their investment account for income in retirement have good reason to be sensitive about market volatility. A precipitous drop in account values might impact the income that the portfolio generates and could accelerate the depletion of investment capital. A retirement portfolio is thus a really good example to demonstrate how choosing and sticking to an asset allocation strategy works against volatility to make it better. To be clear, “sticking” with an allocation strategy means regularly rebalancing the portfolio (either buying or selling stocks or bonds to return to the strategic allocation targets).
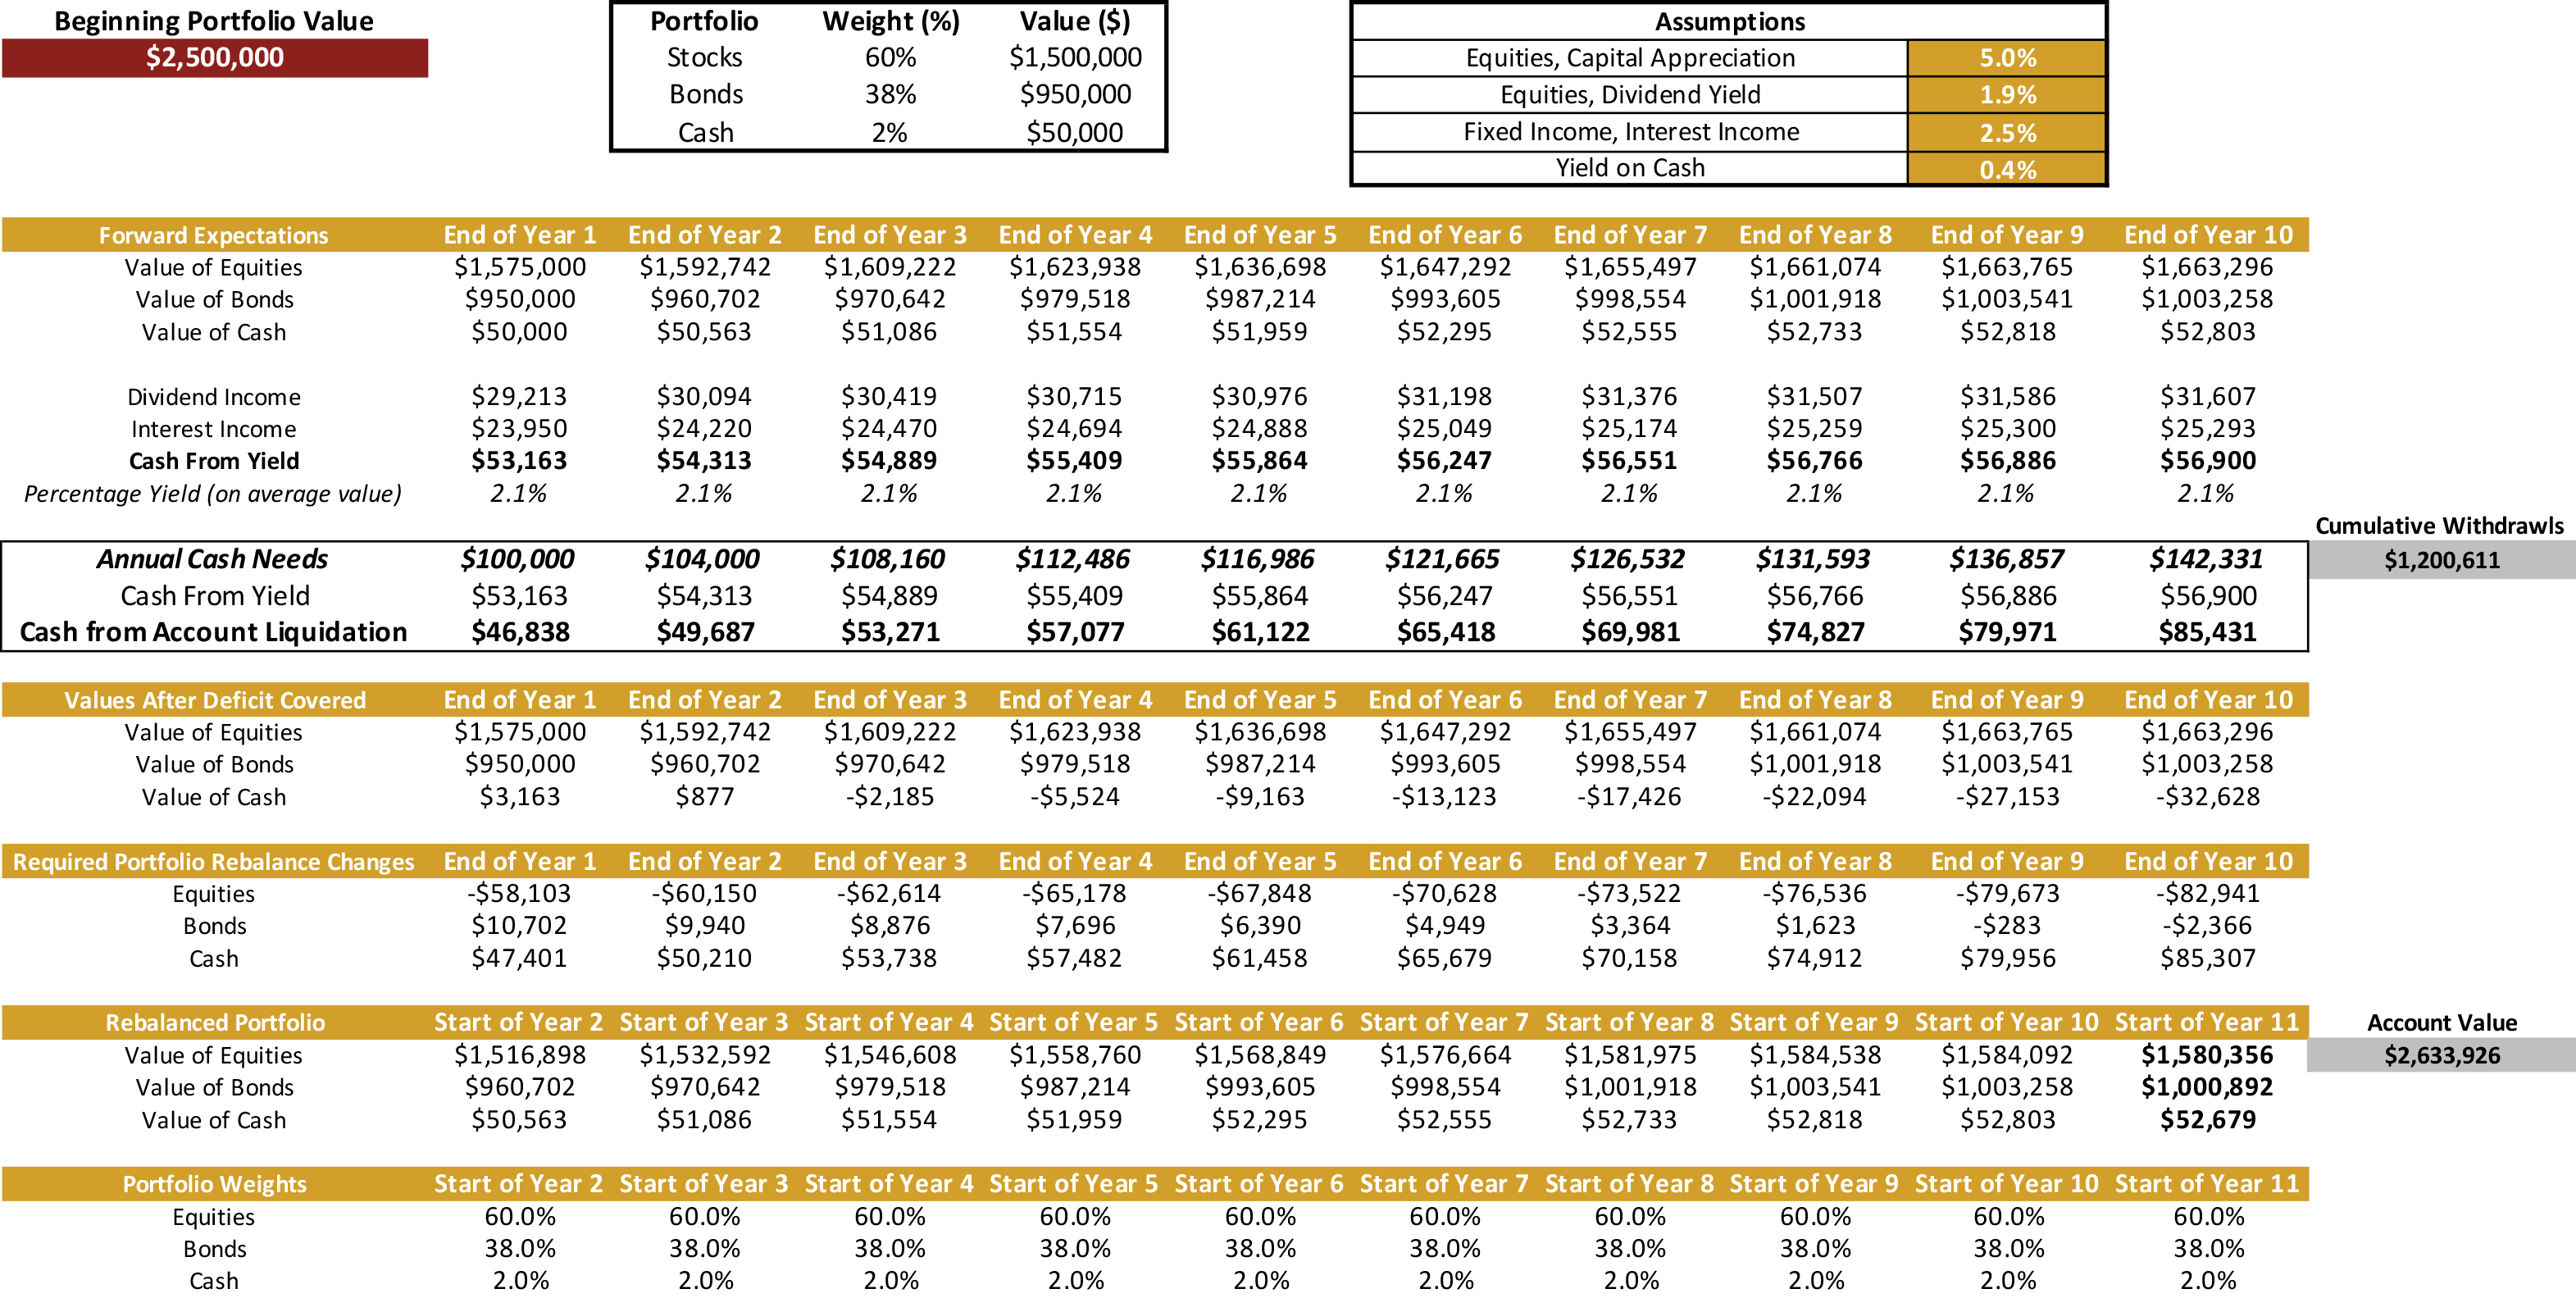
Let’s start by defining what an appropriate (prudent) allocation strategy in a retirement portfolio is. Depending on your “risk personality” (your psychological ability to ride out market volatility), it is probably somewhere between 50% – 70% stocks. For purposes of this demonstration, I am going to split the difference and demonstrate how a 60% stock/ 40% bond portfolio functions (it is actually 60% stocks, 38% bonds, and 2% cash so that income needs for at least 6 months are covered).
Most investors are familiar with the 4% “safe withdrawal” rule. The basic premise is that when you retire, you should set your retirement income from your investment portfolio at 4% of the account value. Each successive year you can give yourself a cost of living increase (in other words, if inflation averages 2%, in year 2 you would receive 2% more than the income you received in year 1). The rationale behind calling 4% a “safe withdrawal” rate is that if you are investing in a moderate strategy (which fairly describes a 60% stock/ 40% bond portfolio), a 4% inflation-adjusted withdrawal rate means that you are withdrawing on average less than the total return of the portfolio (dividends, interest, and appreciation), and not depleting the capital. It is reasonable to assume that a 60/40 portfolio will generate annualized returns of 5% with an acceptable level of volatility risk.
Ok, let’s show how this works in practice. The first example is in the spreadsheet on the link below.
FORWARD-LOOKING PROJECTIONS
FOR ANNUALIZED RETURNS
 CLICK CHART TO ENLARGE VIEW
The starting value of our sample portfolio is $2.5 million, allocated 60% to stocks, 38% to bonds and 2% to cash (thus, the starting values of the assets in Year 1 are $1.5 million in stocks, $950,000 in bonds, and $50,000 in cash.) We assume forward-looking annualized returns in line with historical averages (capital appreciation on equites of 5%, dividend yield on equities of 1.9%, interest income from bonds of 2.5%, and yield on cash of 0.4%). At the end of Year 1, based on these assumptions, we will have generated $53,163 in dividend and interest income; the stocks will now be valued at $1,575 million and the bonds at $950,000. We have set our withdrawals in year 1 to 4% of the starting account value of $2.5 million, or $100,000. Because we are going to withdraw $100,000 to cover our income needs for the next 12 months, that means we will take $53,163 from dividend/bond income, and $46,838 from cash, reducing our cash balance to $3,163.
Now it’s time to rebalance. Our values are out of line with our strategic targets. We need to sell some stocks and buy some bonds and cash in order to return to our 60%/38%/2% targets for stocks, bonds, and cash respectively. By rebalancing, we return to those targets and enter year 2 with the appropriate balances in each asset class. We repeat this process year after year. At the end of 10 years (our sample period), we will have withdrawn $1,200,611 (using our 4% inflation-indexed withdrawal rate). The account will not only have covered all those withdrawals, but because we have rebalanced every year to our strategic targets and withdrawn less than the account is producing on average, our ending account value will be $2,633,926—which is more, not less, than we started with!
Now, I can imagine you might be saying, “that’s fine to demonstrate how that works when you assume smooth annualized returns, but what happens when REAL market volatility hits? Does this allocation/ rebalancing approach provide an antidote to real-world volatility?”
The answer is YES, IT WORKS!! Below is the same type of spreadsheet for a sample $2.5 million portfolio, but this time, we’ve input the actual stock and bond market returns from 2005 – 2014. That means our portfolio is being stress-tested in the 2008/2009 decline—the biggest we’ve encountered in modern times.
ACTUAL HISTORICAL RETURNS
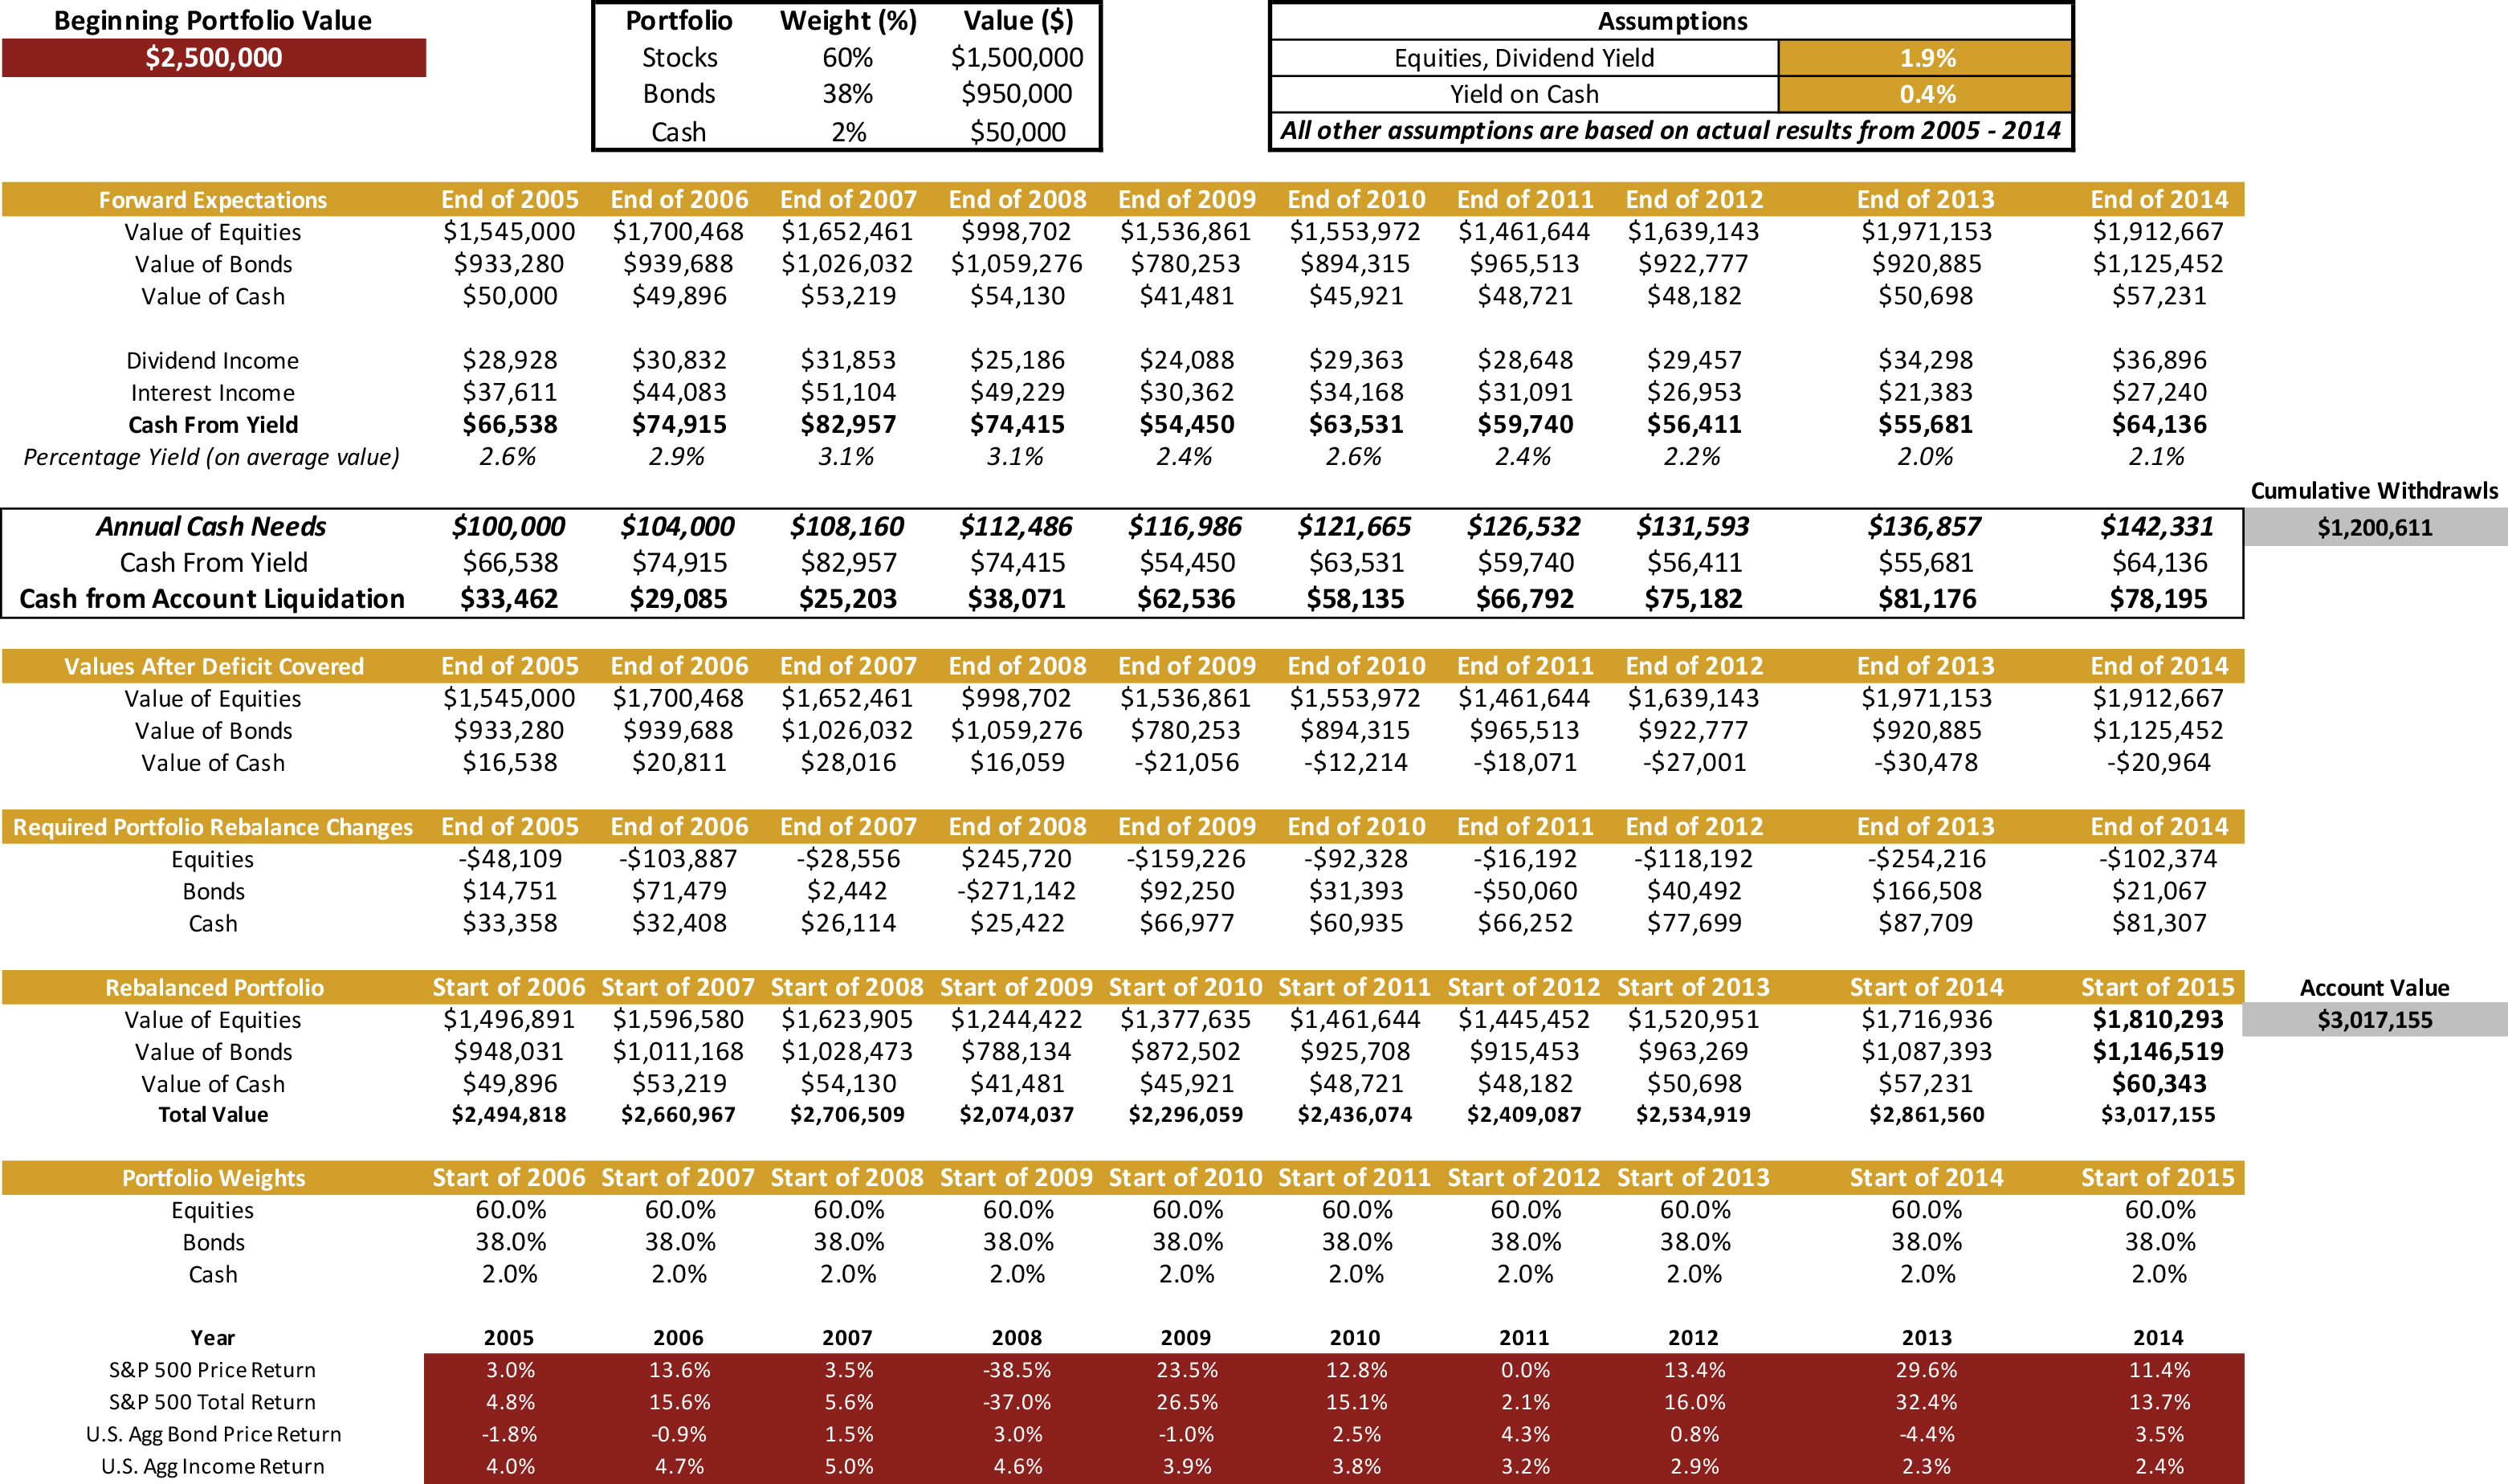
CLICK CHART TO ENLARGE VIEW
Look what would have happened if you were adhering to a 60/40 strategy and the 4% safe withdrawal rate. In 2008, you would have seen the value of your stock portfolio drop from $1,623,905 to $998,702. OUCH! That makes you want to cut bait and run—to get out of the market while you can! But if you would only have adhered to the rebalancing discipline we’re demonstrating, which means selling out of $271,142 in bonds and BUYING $245,720 of stocks (ie., selling (bonds) high and buying (stocks) low), at the end of those 10 years, you would have withdrawn the same $1,200,611, but your account value would actually be worth MORE than under a stable, annualized return scenario (the ending value would be $3,017,155)!
Asset allocation and rebalancing work against volatility, in good times and bad, to make things better.